How Salesforce CRM Analytics helped track team performance
Industry: HR & Staffing
Project Duration: 4 Months
Users: 150
Products Used: TCRM
Overview
A sales outsourcing company had limited or no visibility into its agent performance. The Sales reps were involved in high-volume prospect interaction and different goals for each customer account. After the implementation of Salesforce CRM Analytics, the customer could analyze each customer account’s health and each team’s performance and provide sales coaching based on critical metrics.
The Story of an Outsourcing Company
The company was in the business of sales outsourcing, and at a given point, more than 200 active customers relied on the company to book meetings and close deals. They had more than 125 sales reps who would be assigned to customers and were responsible for ensuring that customer goals were met.
Current State
The company used Salesforce reports and dashboards. However, these reports provided operational information only.
• The company relied on Excel reporting to generate reports.
• These reports didn’t provide insight into team performance or account performance.
“The Executive team spent hours exporting data into Excel to generate its monthly report, often referred to as the “Excel nightmare.” Salesforce CRM Analytics dashboard provided these insights in minutes.”
Business Challenges
As the company grew, monitoring every account and its performance became more difficult. The account management team spent hours exporting the data from different systems into Excel to generate reports. The customer success team had no insights into real-time data regarding how the customer’s account was performing and what sales reps were achieving. The team was only tracking calls and emails sent, but that was insufficient to grasp data insights. The key metrics they were looking for were:
• How many conversations does a sales rep need before booking a meeting?
• What are the industry trends? Are they setting customer goals based on their specific industry?
• What is the sales rep’s performance in terms of the conversion ratio?
• How many calls did it take before converting a lead into an opportunity?
• The call duration and appointment set-to-appointment held ratio
• An analysis of appointments set by emails vs. calls
• How many emails did a sales rep need to send before securing a meeting?
• An analysis of team performance
• An analysis of the customer accounts so they can staff accordingly to meet goals
• Track revenue generated by sales reps for a given account
Their current reporting provided transactional information. However, it didn’t give them insights into their sales cadences and effectiveness.
Technical Challenges
From a Salesforce implementation perspective, it was complex since record types were extensively used. In addition, the customer relied on creating unique record types for each customer to track its prospects and respective prospect activities. Hence, visibility was a complex issue that involved record types, roles, and profiles.
Record types were used to restrict visibility based on customer accounts and provide them with the account hierarchy regarding customer accounts and their corresponding prospect accounts and prospects/contacts. Initially, there was no relationship between these accounts in Salesforce. This made it challenging to display accurate data for customer accounts.
To solve this, we created a custom relationship between customer and prospect account records. We could build data sets in Tableau CRM and display the account hierarchy, its related contacts, the activities/touchpoints, and the sales rep’s goals.
Next, due to the complexity of the organizational configuration, it required the use of multiple data sets to accurately display information on each of the dashboards. This typically isn’t a best practice, but it was needed for this scenario. To ensure the data was interactive on the dashboard, we connected the datasets using a particular field — either record type ID name or owner ID name for the account and sales representative dashboards, respectively.
Why Did the customer choose Salesforce CRM Analytics/TCRM?
TCRM provided them with reporting capabilities, sales insights, and team performance metrics in one integrated platform. In addition, with TCRM, the executive team no longer had to spend hours exporting the data into Excel and generating reports.
How Did We Achieve All This?
The Salesforce implementation was complex, with extensive usage of record types and loosely connected account relationships. Pulling customer accounts, prospect accounts, contacts, and activities was challenging. Hence, we implemented custom functionality to build the object relationships, so TCRM could pull and display data. Our team used SAQL (Salesforce Analytics Query Language) to display the dynamic reference line and depict the goal met vs. the goal set.
The Results
We developed several dashboards that were used at various levels.
• Sales reps and their managers used the sales rep dashboards to understand individual performance.
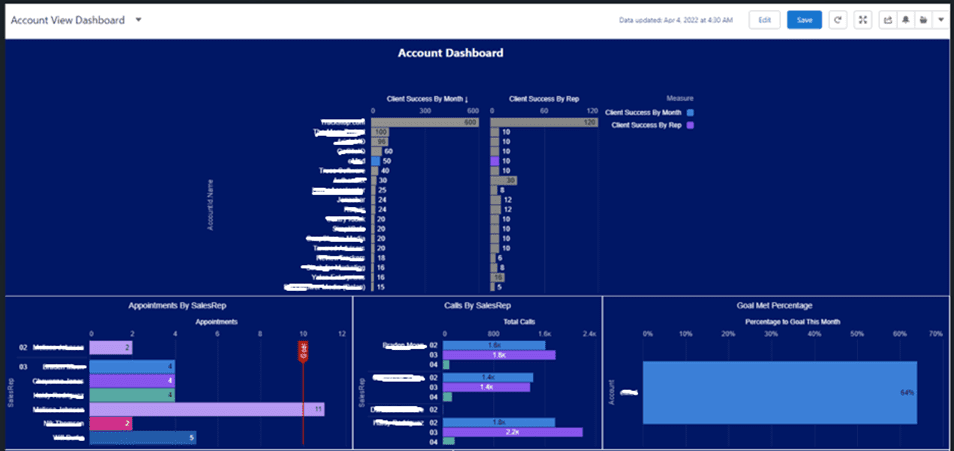
• The executive dashboard was used by company executives to monitor customer accounts across the board and provide actionable insights. This dashboard also provided performance data based on the prior month, quarter, and year for a given account/sales team/sales rep.
• A sales manager dashboard was used to analyze the team’s performance based on goals met, conversion rate, and the number of appointments converted.
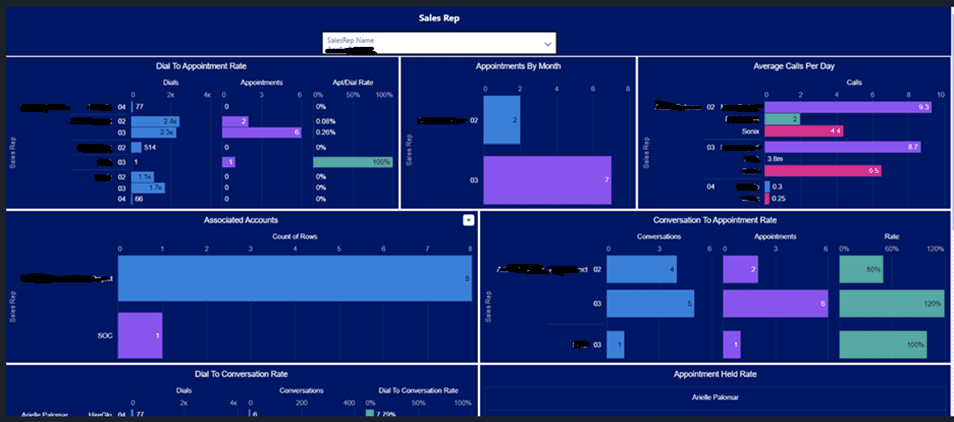
Sales Rep Dashboard
Sales rep dashboard
This dashboard provides insight into a sales rep’s performance against the goal set. The top left quadrant shows the number of customers to whom the sales rep is assigned and the overall stats for these accounts regarding dials, conversations, and the dial-to-conversation ratio.
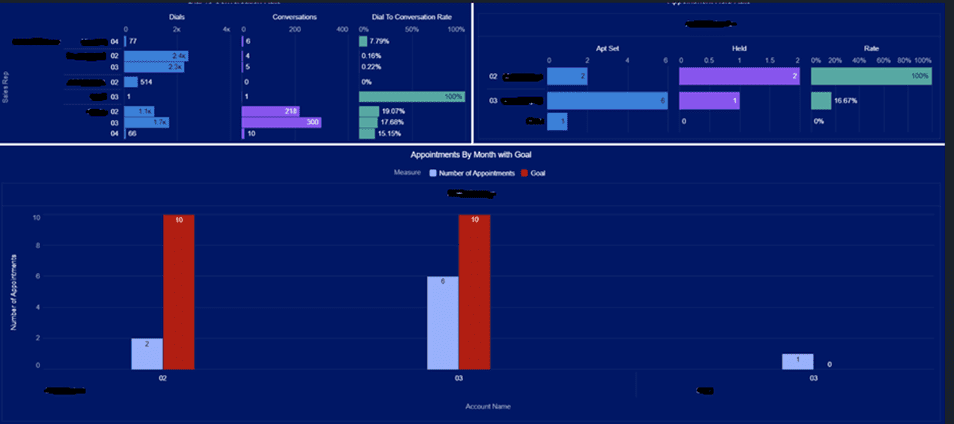
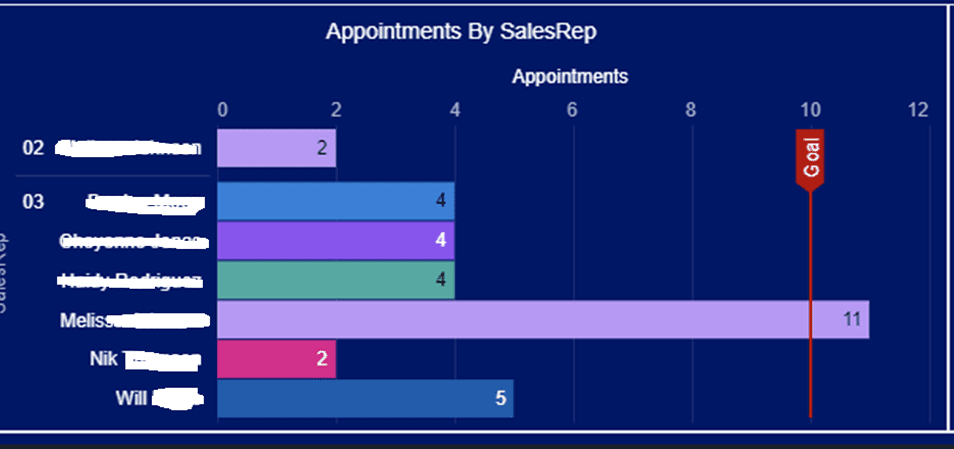
Sales Rep Appointment Metrics Dashboard
Sales Rep Appointment Metrics Dashboard
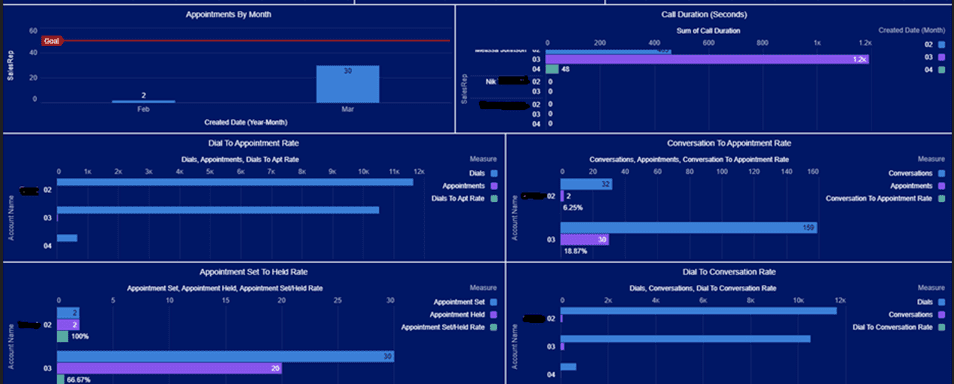
Sales Rep Performance Dashboard
Sales rep performance dashboardExecutive dashboardSales team performance dashboard against goal/quota
Taking Salesforce CRM Analytics to the next level with Revenue Intelligence
Revenue intelligence uses revenue lifecycle visibility created by automation and AI to generate data-driven ways to sell.
From finance to marketing to sales, revenue intelligence gives your organization valuable insights that you can use to take action. For example, sales leaders can use revenue intelligence to keep tabs on pipeline health, while sellers can leverage it for critical information at the right time. For both, it’s key visibility into the health and vitality of your business.
With revenue intelligence, you can direct new sales reps to where they should begin and guide them to take impactful actions, so they can start competing with your best performers and optimizing your bottom line. You can set great forecasts and achieve them because you’ll be able to see the data, know that deals are at the proper stages, and take the right actions at the correct times.
Need More Info?
If you need more information, please contact us at astrecateam@astreca.com or click the link below.
Overview Who couldn’t use a little extra help? That’s the promise of agentic AI: building autonomous AI agents that can perform tasks for people. A rapidly growing services organization was happy with their Salesforce-based project management application but was feeling growing pains around reporting and monitoring. As the project portfolio expanded, managers found it increasingly […]
Overview Project managers often need information fast. Daily huddles, one-to-one meetings, and weekly scrums require instant access to information. For a leading services organization, Salesforce provided a stable, ready source of data, yet it required multiple login steps and a desktop to access the data. Project managers need it on the fly, but the system […]
Our client, a leading firm in the government and technology sector, struggled with ever-increasing licensing fees from third-party AppExchange apps. Crucial data from separate databases and websites lived outside of their Salesforce environment, leading to missed opportunities. Every workflow adjustment resulted in costly customization fees and delays. The company desperately needed help ensuring clean, […]